Consider a lattice, where we place pebbles with probability $p$ at each intersection. Neighboring pebbles are considered to be connected, forming clusters of size two or more. We are mainly interested in sizes of these clusters.
Key questions:
- What is the expected size of the largest cluster?
- What is the average cluster size?
- What is the mean distance between two nodes the belong the same cluster?
- What is the probability that a randomly chosen node belongs to the largest cluster?
As $p$ increases, clusters obviously become larger and average cluster size gets much bigger. If $p$ approaches a critical value, $p_c$ small clusters grow and coalesce, leading to the emergence of a huge cluster at $p_c$. This is not a gradual process, rather it is kind of a phase transition occurring at $p_c$
Average Cluster Size: $\langle s \rangle$
$$ \langle s \rangle \sim {\mid p-p_c \mid}^{-\gamma_p} $$
Average cluster size diverges as we approach $p_c$.
Order Parameter: $P_\infty$
The probability $P_\infty$ that a randomly chosen pebble belongs to the largest cluster, for $p>p_c$ is given by;
$$ P_\infty \sim (p-p_c)^{\beta_p}. $$
As $p$ decreases towards $p_c$ the $P_\infty$ drops zero by definition.
Correlation Length: $\xi$
The mean distance between two pebbles that belong to the same cluster follows
$$ \xi \sim {\mid p-p_c \mid}^{-\nu}. $$
Critical Exponents: $\gamma_p, \beta_p, \nu$
The exponents $\gamma_p, \beta_p, \nu$ are called critical exponents. They characterize system’s behavior near critical point $p_c$. Percolation theory predicts critical exponents are universal, they are independent of the nature of the lattice (e.g. square or triangle) or the precise value of $p_c$. They only depend on the dimensionality of the lattice, in fact for dimension $d>6$, critical exponents stay constant.
Percolation and Network Breakdown as Inverse Percolation
We can further define $f=1-p$, as removing a pebble/node from the lattice and investigate how network is damaged and what kind of dynamics govern network breakdown process.
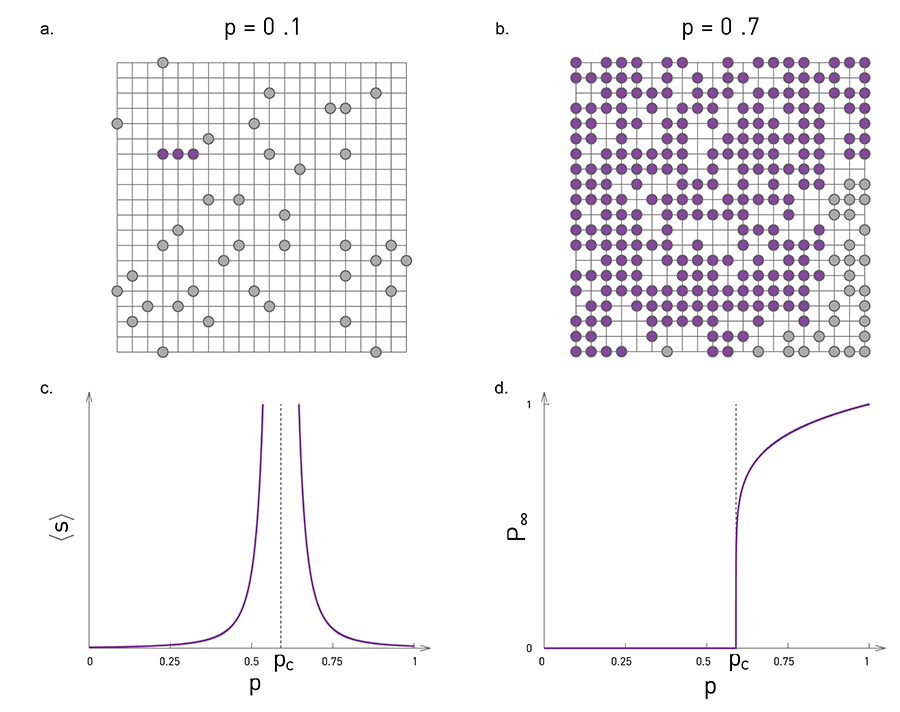
Fig. 1 - Percolation on a grid.
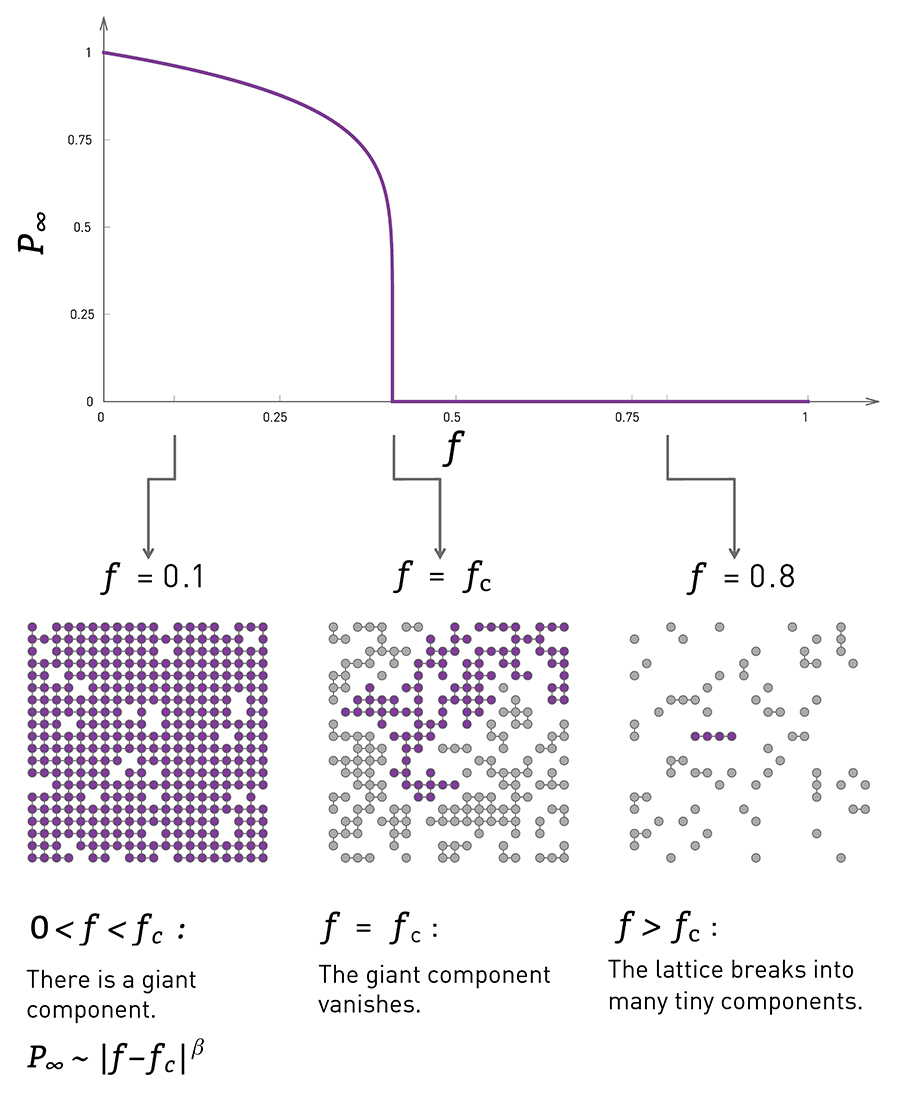
Fig. 2 - Inverse percolation.
See An Introduction to Percolation for more details.